Demo · Global Hydrological Zoning
Hydrological Zones
A data-driven map of how the world's watersheds behave hydrologically. I aggregated two-plus decades of daily satellite and land-surface model data onto the HydroBASINS watershed polygons — every basin gets a daily time series of five water-balance variables plus a static channel stream gradient — and from that per-basin hydrological-year climatology (water year Oct 1 – Sep 30) I derive a set of hydrological zones. The variable maps below are the ingredients; the zoning thresholds at the bottom turn them into Köppen-style classes.
Datasets used
HydroBASINS
Pfafstetter nested watershed polygons, levels 6 (16,397) and 7 (57,646), global — the zoning units. WWF & McGill University; Lehner & Grill (2013).
GPM IMERG Final
Daily precipitation at 0.1°, Version 06 (2000–2020) spliced with Version 07 (2021–2025). Reliable to |lat| 60–70°. NASA GES DISC; Huffman et al.
GLDAS-2.2 CLSM
Daily land-surface model at 0.25° — surface temperature, evapotranspiration, surface + subsurface runoff, and groundwater storage (2003–2026). NASA GES DISC.
HydroSHEDS DEM
Void-filled digital elevation (3 arc-sec ≈ 90 m where available, else 15 arc-sec ≈ 500 m) — basin relief for the stream gradient. HydroSHEDS.
HydroRIVERS v1.0
Global vectorised river network — the basin main stem is traced from the outlet upstream by maximum upstream drainage area, giving the gradient's length term. WWF & McGill.
Water input
Precipitation
Mean annual precipitation traces the great wet belts — the tropics, monsoon Asia, and the maritime mid-latitudes — against the deserts of the subtropics and continental interiors. This is the primary forcing of every other variable on this page.
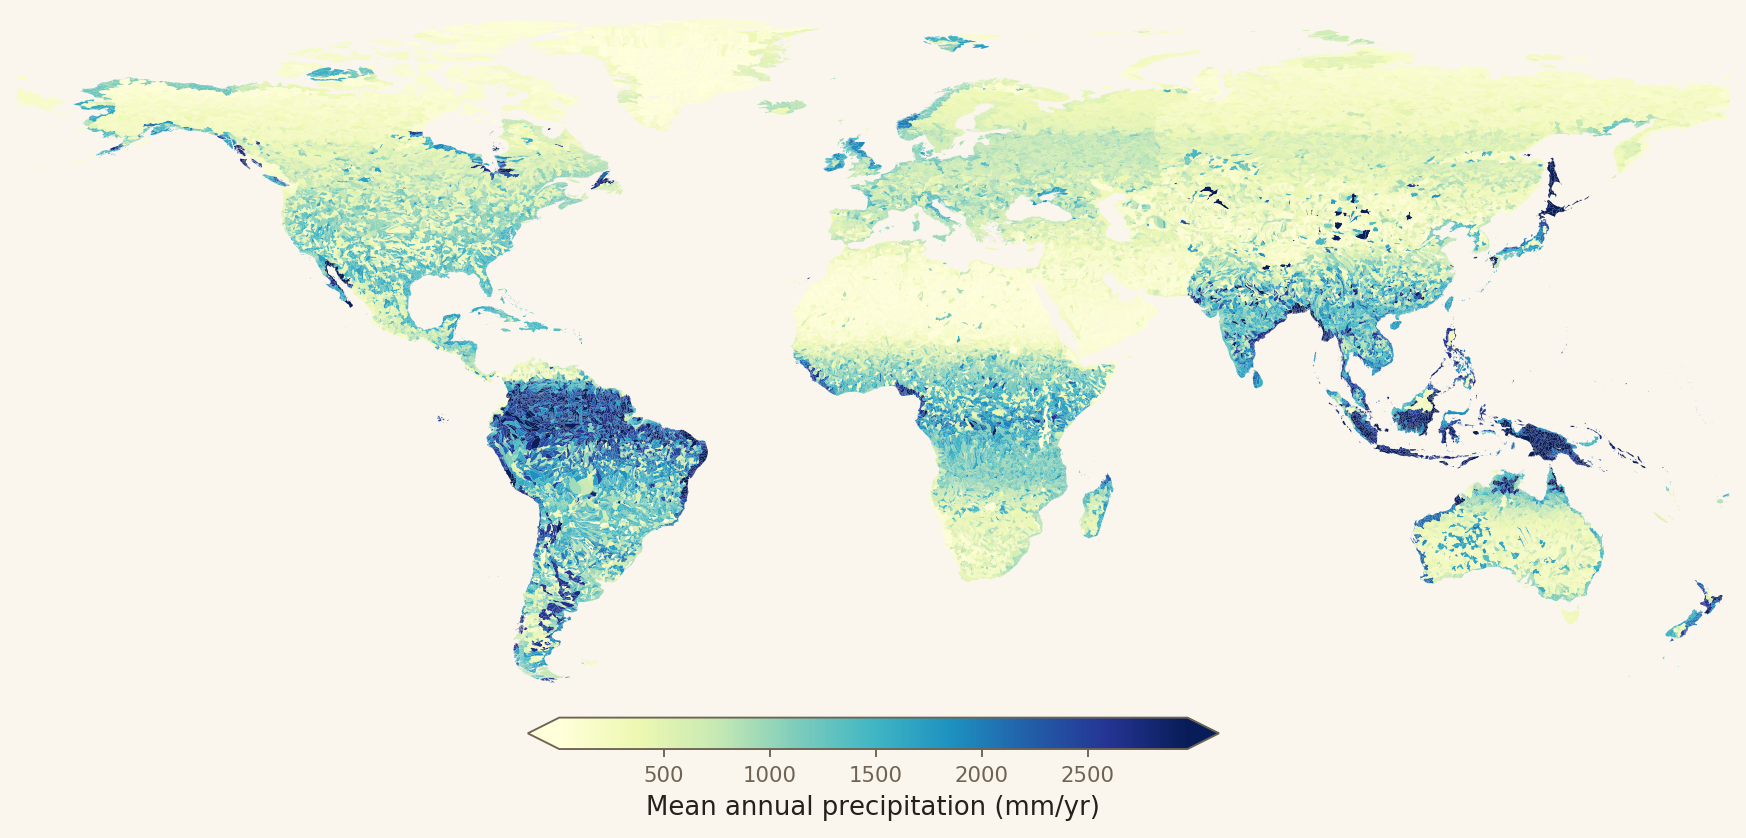
Interactive · level-7 basins · hover a basin for its value · scroll to zoom
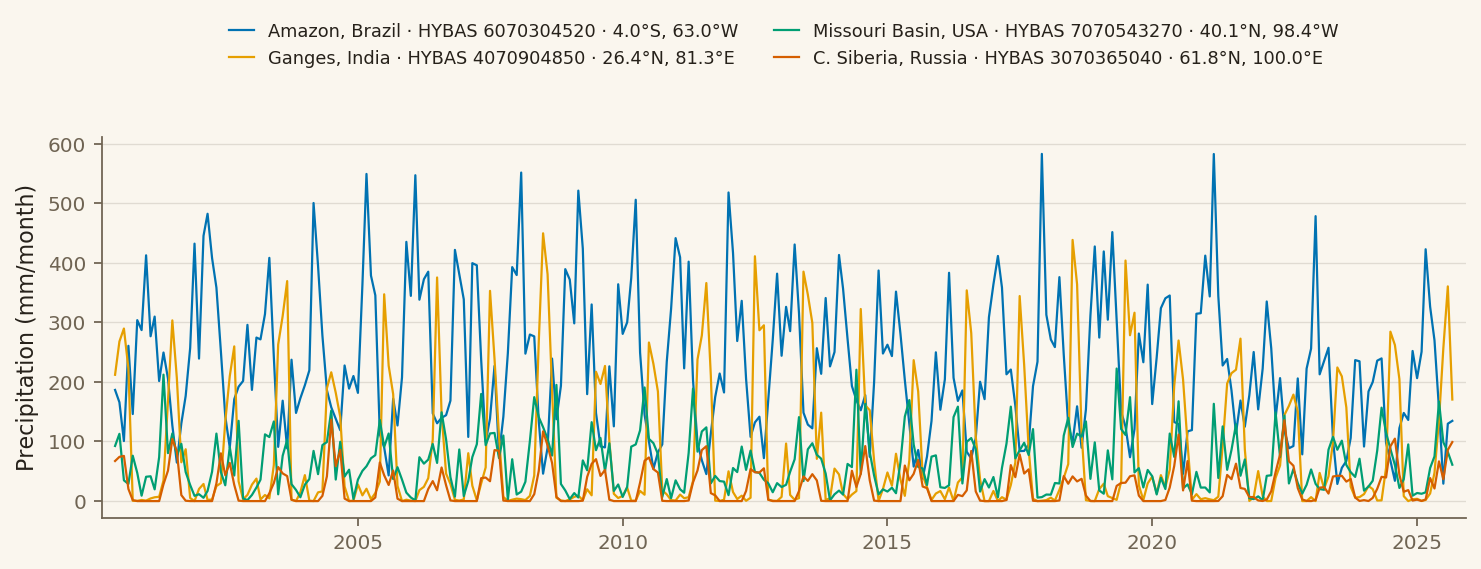
Source: NASA GPM IMERG Final daily precipitation (0.1°) — Version 06 (2000–2020) spliced with Version 07 (2021–2025). Basin means are area-weighted over the 0.1° grid. Huffman et al., GPM IMERG, NASA GES DISC.
Energy
Surface temperature
Average surface skin temperature, the energy signal behind evaporative demand. The diverging scale is centered on 0 °C, separating basins that spend the year above freezing from the cold high-latitude and high-altitude watersheds.
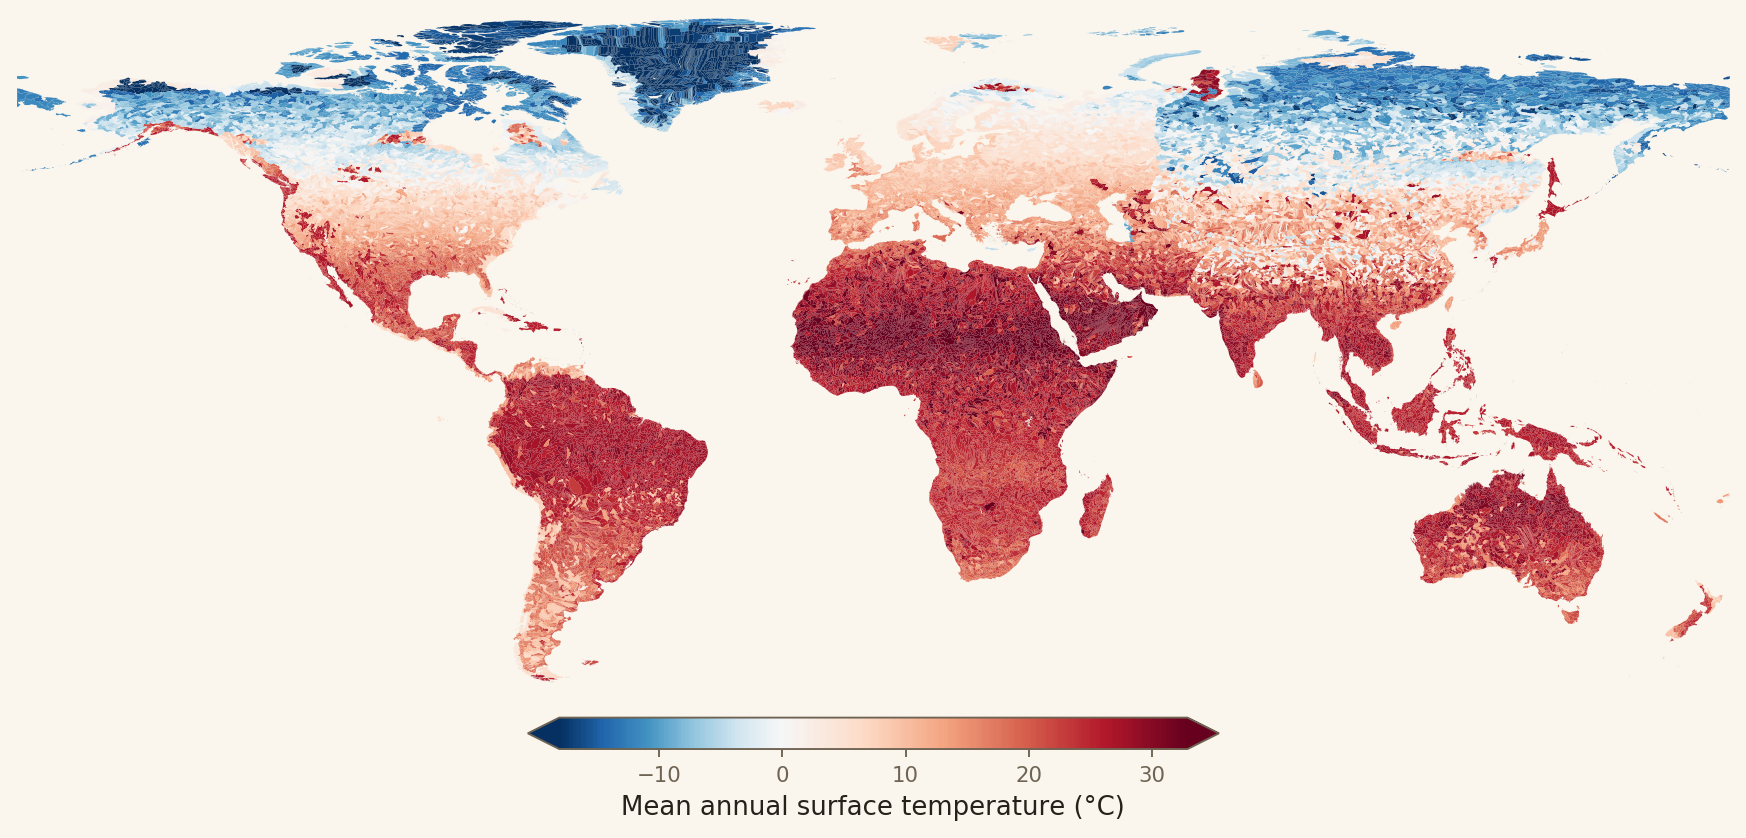
Interactive · level-7 basins · hover a basin for its value · scroll to zoom
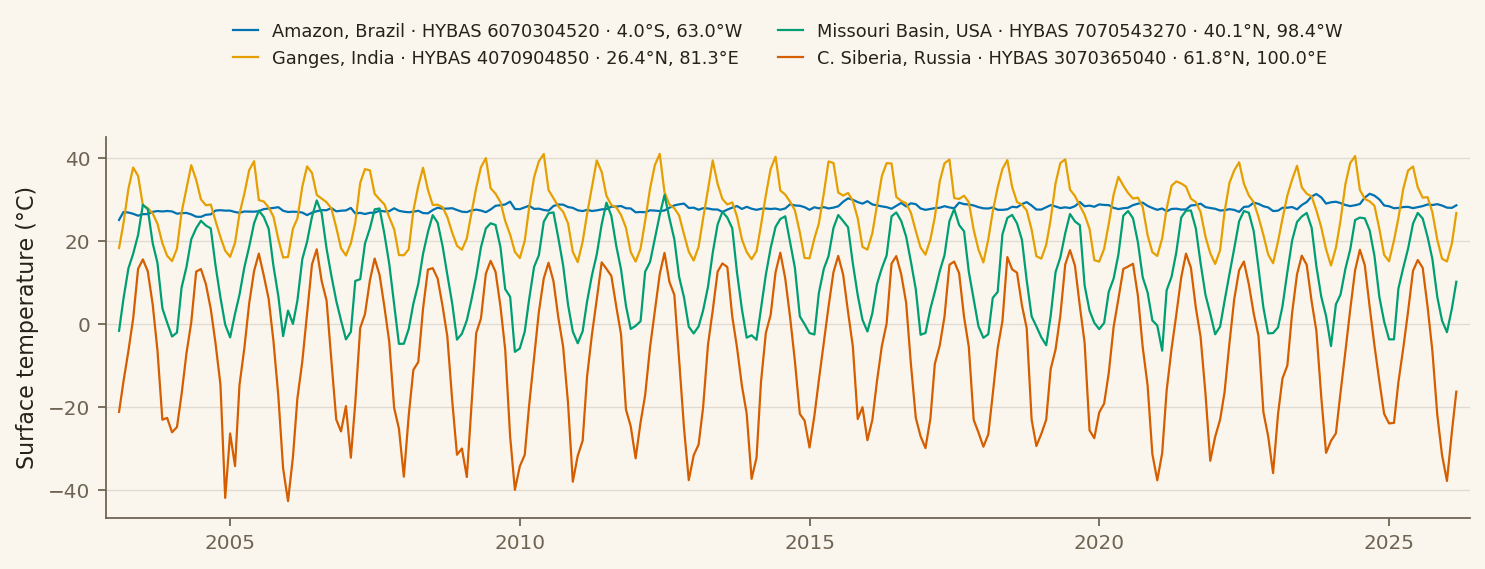
Source: NASA GLDAS-2.2 Catchment Land Surface Model (CLSM),
daily 0.25° (AvgSurfT_tavg), converted from kelvin to °C and area-weighted to
each basin. Rodell et al., GLDAS, NASA GES DISC.
Water output
Evapotranspiration
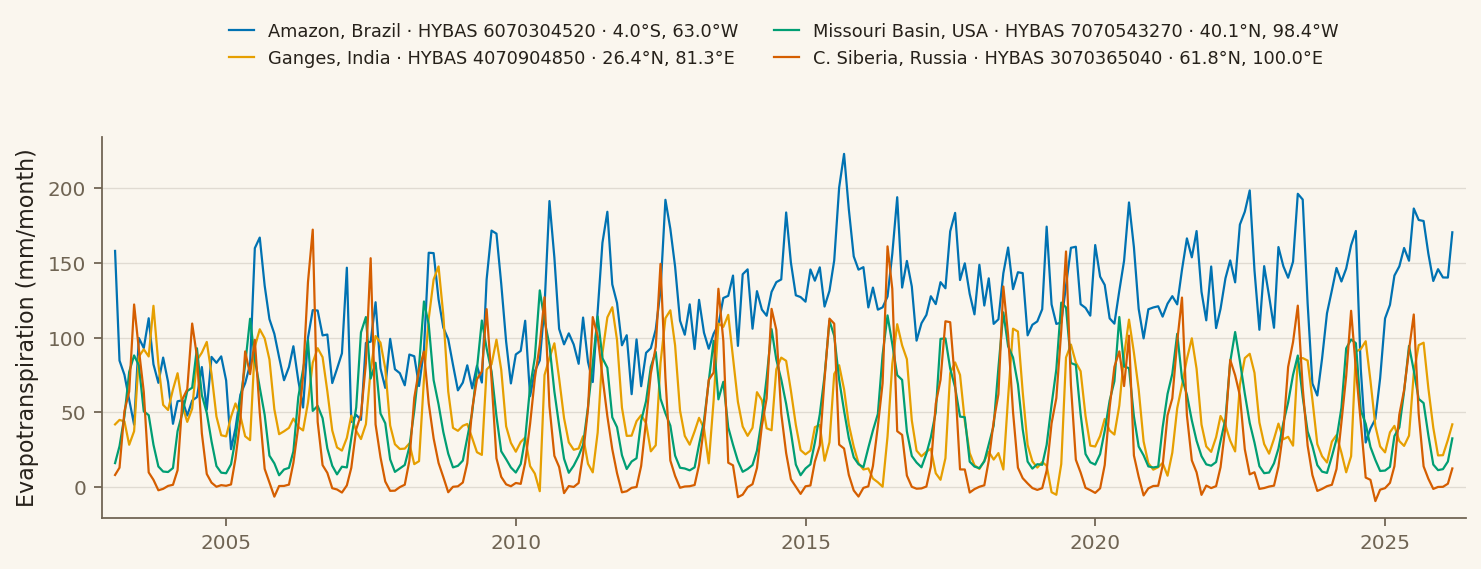
The water returned to the atmosphere by evaporation and plant transpiration. ET is high where both water and energy are abundant (humid tropics) and suppressed by either cold (poleward basins) or dryness (deserts, where it is limited by supply rather than demand).
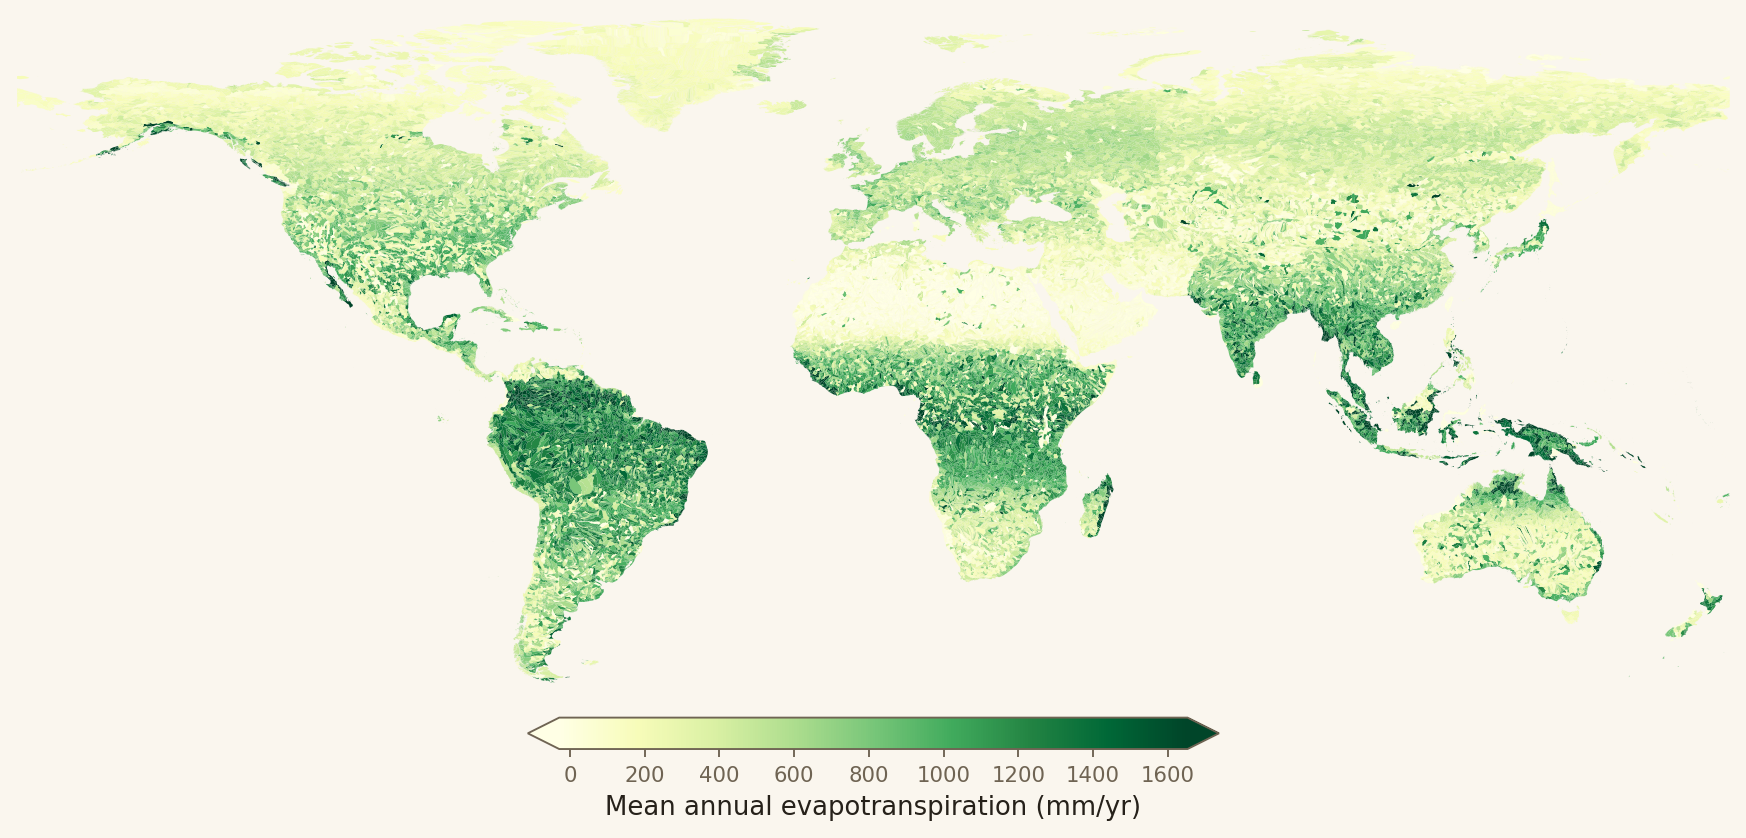
Interactive · level-7 basins · hover a basin for its value · scroll to zoom
Source: GLDAS-2.2 CLSM Evap_tavg [kg m⁻² s⁻¹], converted to
mm/day (×86 400) then summed to an annual total. Physically impossible cell values
(< −1 mm/day condensation) were screened as artifacts before aggregation.
Water output
Runoff
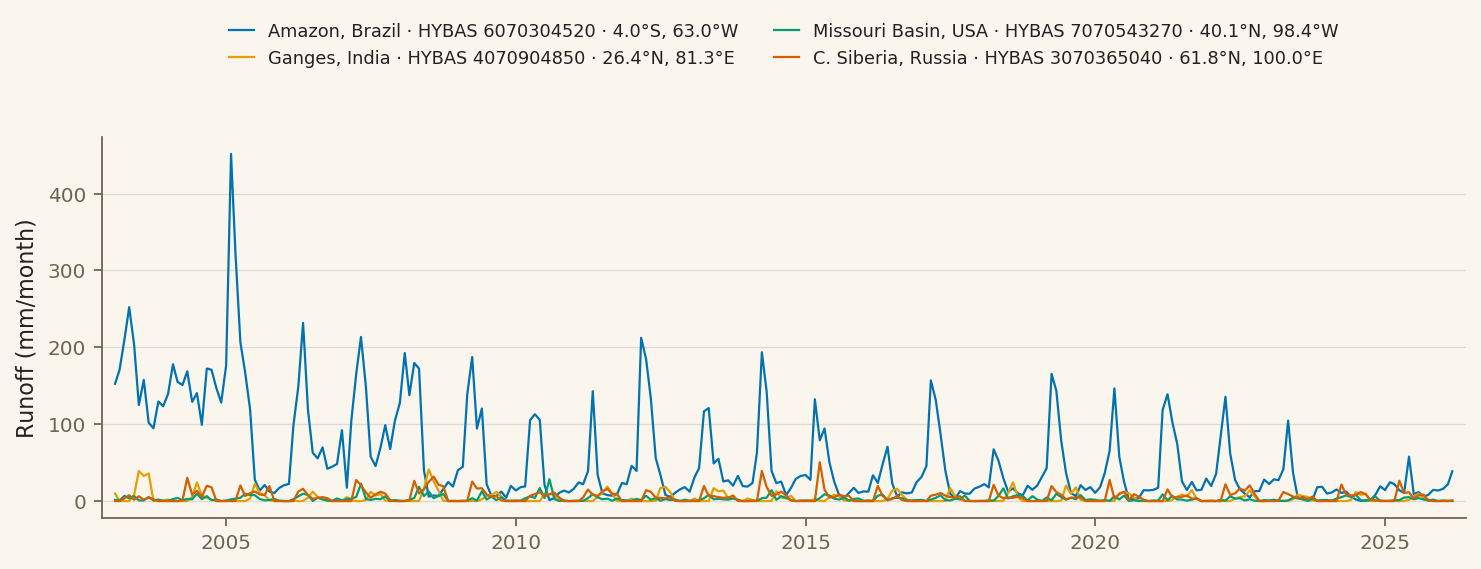
Total runoff — surface storm runoff plus subsurface baseflow — is the water that leaves the basin as streamflow. It concentrates in wet, steep, and snowmelt-fed regions and effectively vanishes across arid interiors.
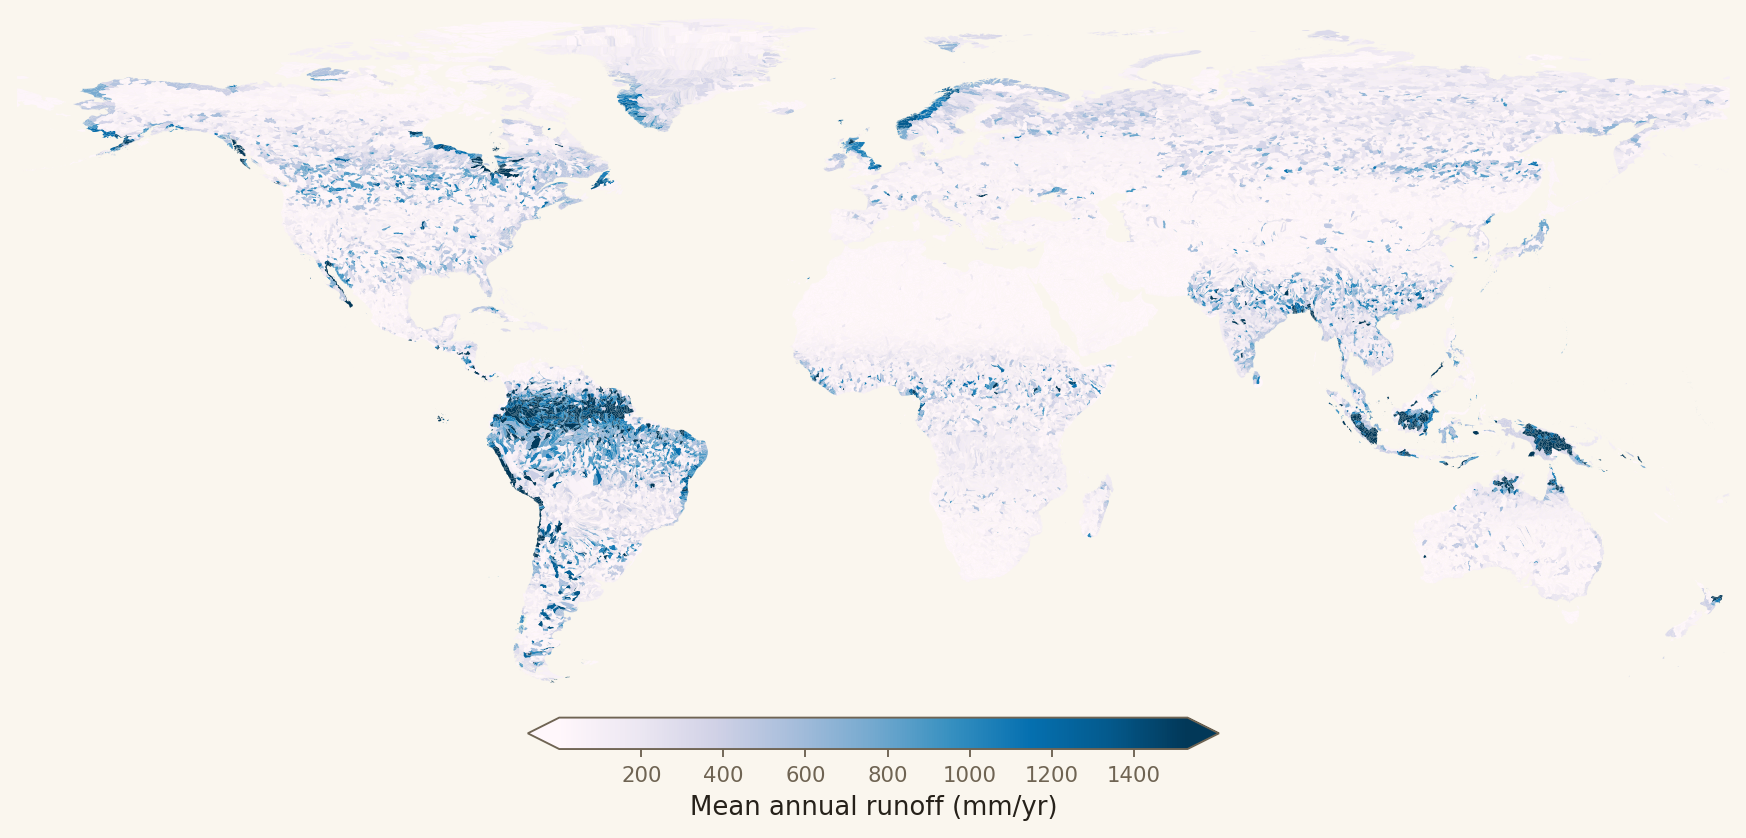
Interactive · level-7 basins · hover a basin for its value · scroll to zoom
Source: GLDAS-2.2 CLSM Qs_tavg (storm surface runoff) +
Qsb_tavg (baseflow), each [kg m⁻² s⁻¹] → mm/day → annual sum, area-weighted per basin.
Storage
Groundwater storage
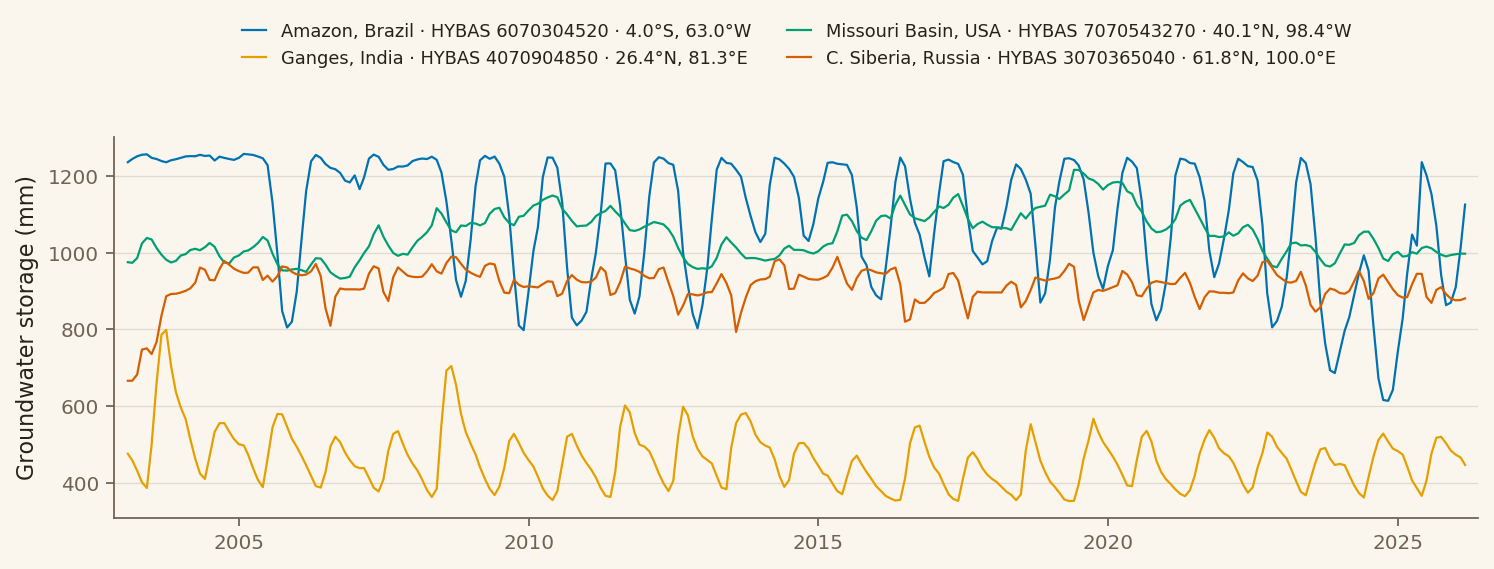
The modeled groundwater held in each basin — a state variable, so it is averaged rather than summed. It reflects the long-term balance of recharge and drainage and the water-holding capacity of the landscape.
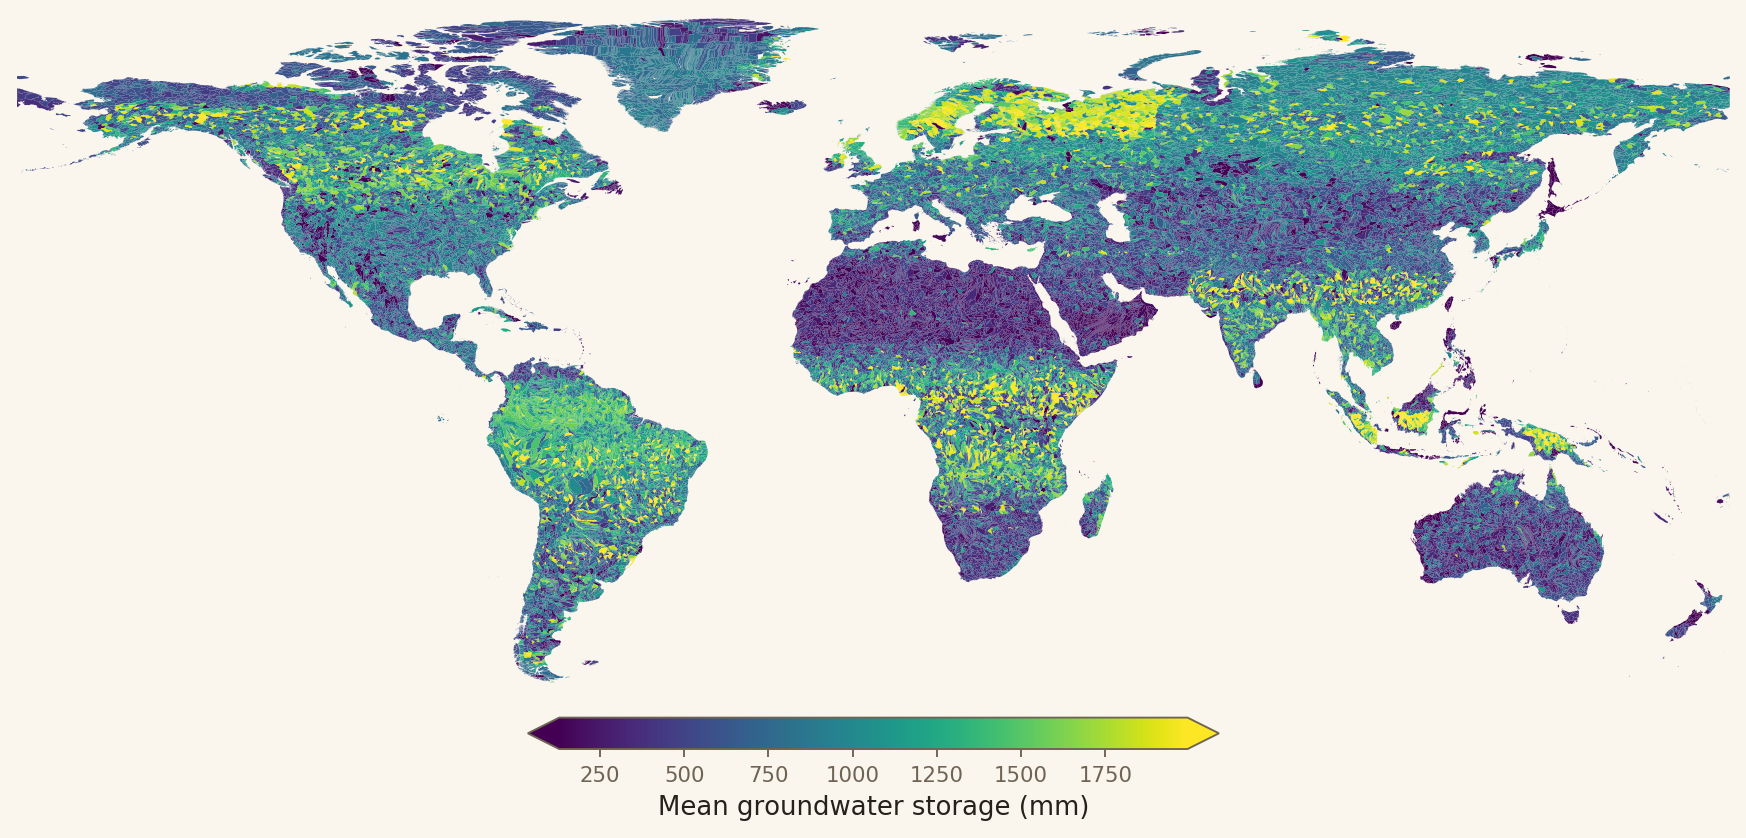
Interactive · level-7 basins · hover a basin for its value · scroll to zoom
Source: GLDAS-2.2 CLSM GWS_tavg [mm], area-weighted basin mean.
Terrain (static)
Stream gradient
A morphometric descriptor rather than a climate variable: the basin relief (highest minus lowest elevation) divided by the length of its main stem, expressed dimensionlessly as m/m. Because it spans several orders of magnitude, it is shown on a logarithmic scale — high in mountainous headwaters (yellow) and low across floodplains and cratonic lowlands (dark), which helps explain why some basins are flashy while others are slow.
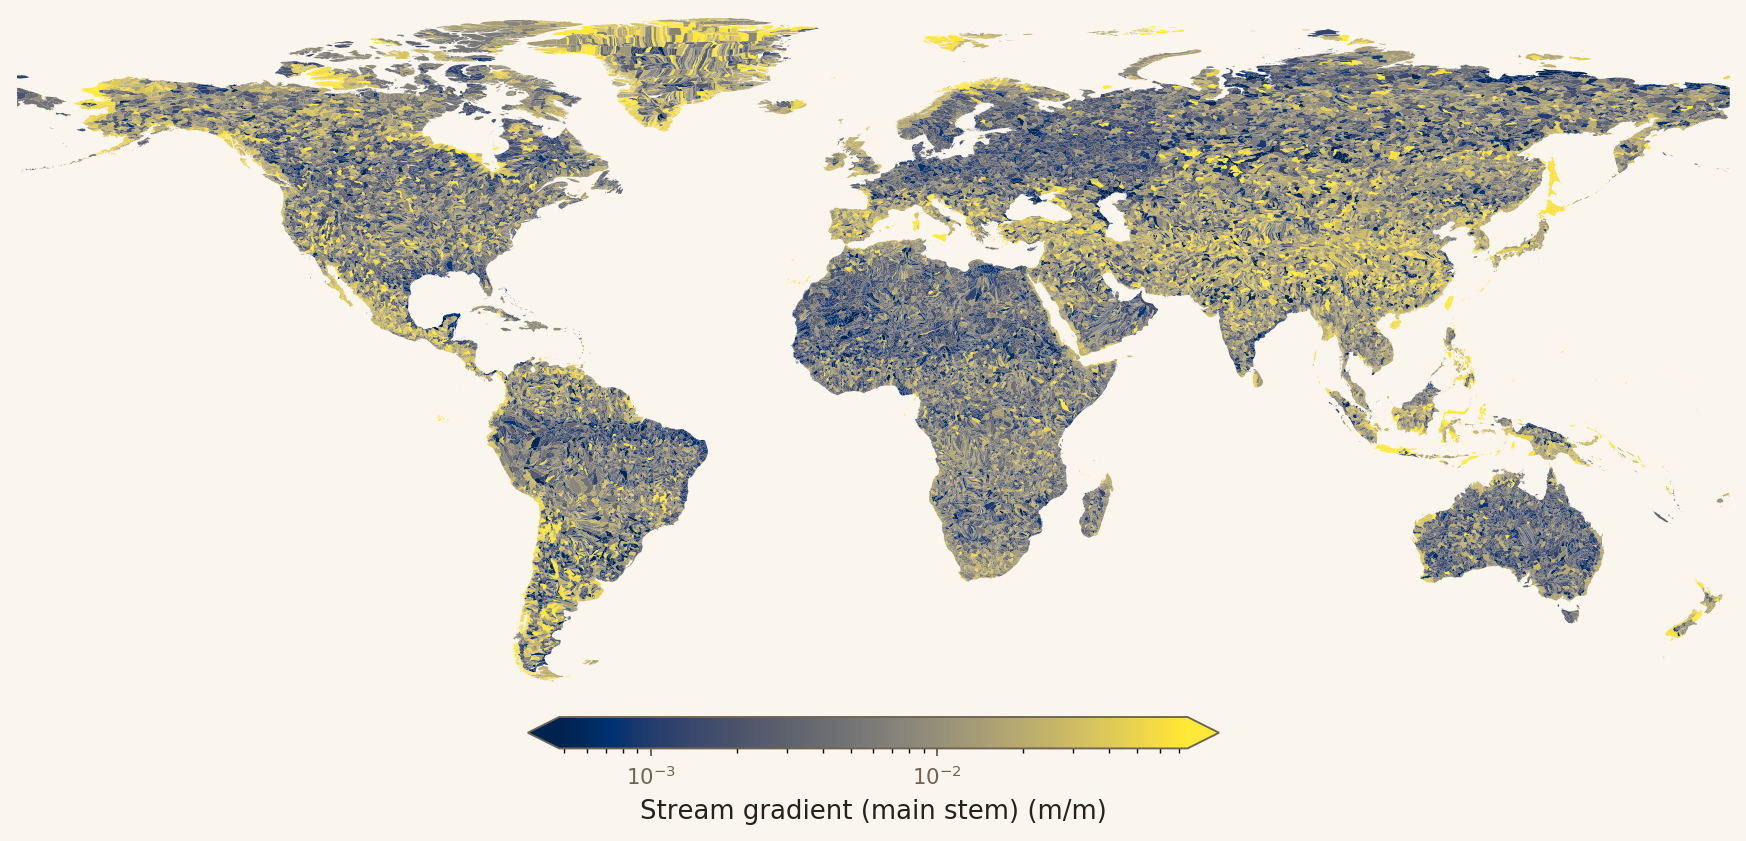
Interactive · level-7 basins · log color scale · hover a basin for its value · scroll to zoom
Stream gradient is a static basin property — no time series.
Source: HydroSHEDS void-filled DEM (3 arc-sec ≈ 90 m where available, else 15 arc-sec ≈ 500 m) for basin relief, and HydroRIVERS v1.0 for the main stem — traced from the outlet upstream, following the maximum upstream-drainage-area reach at each confluence. Lehner & Grill (2013), HydroSHEDS.
Classification
Hydrological zoning thresholds
To turn the continuous variables above into hydrological zones, each is binned by a small set of thresholds chosen for hydrological meaning and grounded in the climate-classification literature — the Köppen-Geiger backbone (temperature × precipitation), UNEP/FAO aridity bands, and the Budyko energy-vs-water framework. Crossing the temperature and precipitation axes reproduces the familiar Köppen A/B/C/D/E families; the runoff, evapotranspiration, terrain, frost and groundwater axes add the hydrology Köppen omits.
| Axis | Variable | Thresholds | Classes (low → high) | Basis |
|---|---|---|---|---|
| Thermal | Mean annual temperature | 0, 10, 18 °C | Polar/Boreal · Cold · Temperate · Tropical | Köppen A/C/D/E |
| Aridity | Annual precipitation | 250, 600, 1200 mm/yr | Arid · Semi-arid · Sub-humid · Per-humid | UNEP/FAO aridity |
| Yield | Runoff ratio (Q/P) | 0.1, 0.3, 0.6 | Very-low · Low · Moderate · High | water yield |
| Limit | Evaporative index (ET/P) | 0.5, 0.9 | Energy-limited · Intermediate · Water-limited | Budyko |
| Terrain | Stream gradient | 2, 10 m/km | Lowland · Upland · Mountain | relief |
| Frost | Frost days/yr (T < 0 °C) | 1, 30, 150 | Frost-free · Seasonal-light · Seasonal-strong · Persistent | snow regime |
| Storage | Groundwater seasonal amplitude | 30, 100, 250 mm | Buffered · Seasonal · Strongly-seasonal · Extreme | storage buffering |
- Köppen backbone letter (merges temperature × precipitation): A Tropical, C Temperate, D Cold, E Polar/Boreal — with B Arid overriding the thermal letter wherever a basin is arid.
- Merged code concatenates one symbol per axis —
[backbone][yield][limit][storage][terrain](frost)— e.g.DlwZuF= cold semi-arid, low-yield, water-limited, strongly-seasonal storage, upland, persistent frost. - Coverage: precipitation from IMERG is unreliable over polar ice, so basins poleward of |lat| 70° are masked out of the zoning.
Methods & data provenance
- Basins: HydroBASINS (Pfafstetter) levels 7 (57,646) and 6 (16,397), global.
- Zonal statistics: exact fractional cell–basin overlap-area weights, computed once per grid; each daily field is an area-weighted basin average. Fluxes use Σ(value·cell area) ⁄ basin area.
- Hydrological year: Oct 1 – Sep 30. Fluxes (P, ET, runoff) summed to an annual total then averaged over water years; states (temperature, groundwater) averaged. A water year counts for a basin only when ≥ 350 valid days are present.
- Temporal coverage: precipitation 2000–2025 (IMERG); GLDAS variables 2003–2026.
- Quality control: negative ET below −1 mm/day (non-physical) and other out-of-range source cells are screened before aggregation; a raw, unscreened copy is retained.
- Data products: NASA GES DISC (GLDAS-2.2 CLSM, GPM IMERG) and HydroSHEDS / HydroRIVERS / HydroBASINS (WWF & McGill University).